The Chronicles Of Grant County
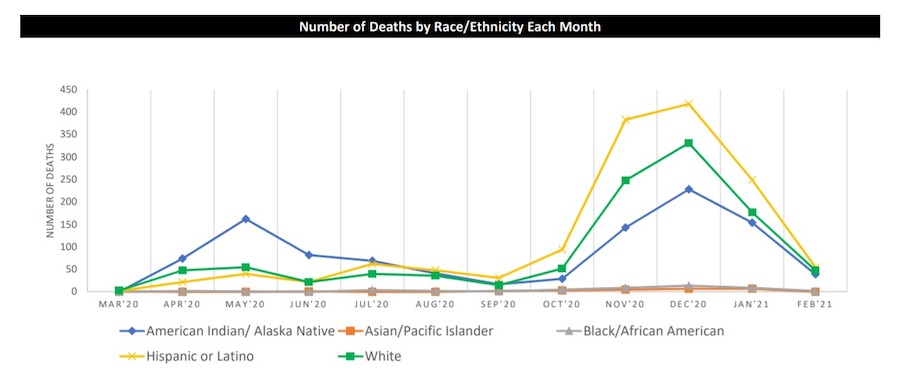 This graph shows the relative levels of deaths from COVID-19 Disease among five major racial/ethnic groups within the State of New Mexico. The yellow line represents the number of COVID-19 deaths among Hispanic Americans in New Mexico, the green line represents the number of COVID-19 deaths among Non-Hispanic White Americans in New Mexico, and the blue line represents the number of COVID-19 deaths among Native Americans in New Mexico. The gray line, representing the number of COVID-19 deaths among Non-Hispanic Black Americans in New Mexico, and the orange line, representing the number of COVID-19 deaths among Americans of Asian and Pacific Island heritage in New Mexico, overlap one another for many months in this graph. (This graph was provided courtesy of the New Mexico Department of Health, 2021.
{pdf}mypdfs/pdf-new-mexico-department-of-health-image-of-relative-levels-of-deaths-covid-19-pandemic-one.pdf{/pdf}
PDF - New Mexico Department of Health - Image of Relative Levels of Deaths - COVID-19 Pandemic
Last week's edition of The Chronicles Of Grant County detailed two reports about the decrease in life expectancy levels among three major racial/ethnic groups – Hispanic Americans, Non-Hispanic Black Americans, and Non-Hispanic White Americans from Year 2019 to Year 2020 within the United States. One of the reports was issued by the Federal government through the National Center for Health Statistics using information collected through its National Vital Statistics System, while the other report included life expectancy level estimates prepared by researchers from Princeton University and the University of Southern California and was issued by the National Academy of Sciences.
The Chronicles Of Grant County noted that those two reports made no mention of life expectancy levels of Asian Americans or Native Americans.
"We are currently working to expand the U S life table program to include life tables for the Asian and Native American populations," according to a statement from the National Center for Health Statistics of the Centers for Disease Control and Prevention (CDC). "Problems with data quality has been the main reason we have not produced official U S life tables for these groups in the past. However, through a combination of improvement in data quality and the development of methods to address the data quality problems, we will be able to publish life tables for these populations soon."
While the impact of the COVID-19 Pandemic on the levels of life expectancy are not officially known at this time for Americans of Native American heritage and Asian heritage, there is no doubt about the severity of the impact of the COVID-19 Pandemic among Native Americans in the State of New Mexico.
The graph at the top of this news column, provided courtesy of the New Mexico Department of Health, details the relative levels of deaths from COVID-19 Disease among five major racial/ethnic groups within the State of New Mexico. The yellow line on the graph represents the number of COVID-19 deaths among Hispanic Americans in New Mexico, the green line represents the number of COVID-19 deaths among Non-Hispanic White Americans in New Mexico, and the blue line represents the number of COVID-19 deaths among Native Americans in New Mexico. The gray line, representing the number of COVID-19 deaths among Non-Hispanic Black Americans in New Mexico, and the orange line, representing the number of COVID-19 deaths among Americans of Asian and Pacific Island heritage in New Mexico, overlap one another for many months in this graph.
The graph at the end of this news column, also provided courtesy of the New Mexico Department of Health, details the actual number of COVID-19 deaths among the five major racial/ethnic groups. The actual numbers – highlighting human beings who died because of COVID-19 Disease – include 1, 426 Hispanic Americans, 1,075 Non-Hispanic White Americans, and 1,038 Native Americans who died of COVID-19 Disease within the State of New Mexico from March 1, 2020, through February 22, 2021.
To put these numbers into perspective, of all those that have died from COVID-19 Disease in New Mexico, 39.2% were Hispanic Americans, 29.6% were Non-Hispanic White Americans, and 28.6% were Native Americans, according to the New Mexico Department of Health.
According to the U S Census Bureau, approximately 2.1 million people live in the State of New Mexico in 2019. The Census Bureau reported that in 2019, approximately 11% of New Mexicans were of Native American heritage, and approximately 49% of New Mexicans were of Hispanic heritage.
"Multiple agencies within the State of New Mexico have been working with sovereign tribes and nations within our state's borders as well as other partners over the course of the Pandemic," stated David Morgan, Media and Social Media Manager of the New Mexico Department of Health. "Efforts have included helping coordinate temporary places to stay when family members are diagnosed with COVID-19 and their families required isolation to try to slow or prevent spread. The State has also provided other essential services such as COVID-19 testing, and when unable to travel for essential supplies, coordinating food deliveries where needed."
The impact of the COVID-19 Pandemic among Native Americans has been felt not just in New Mexico but in communities throughout the United States. On August 28, 2020, the CDC released a report entitled "COVID-19 Among American Indian and Alaska Native Persons — 23 States, January 31–July 3, 2020." You can view this report by clicking here.
Commenting on this recent CDC report, IHS indicated that "…the overall occurrence of lab-confirmed COVID-19 among American Indians and Alaska Natives was 3.5 times that among Non-Hispanic White persons and the highest hospitalization rate of any racial or ethnic group. Native individuals are also over four times more likely to be hospitalized as a result of COVID-19. American Indians and Alaska Natives also have high rates of certain co-morbidities that have been linked to poor outcomes with COVID-19, including diabetes, hypertension, and obesity. In addition to many public health measures in place, such as social distancing, mandatory curfews and closures, mask wearing and handwashing, COVID-19 vaccination remains the most promising intervention to further reduce disease, morbidity, and mortality in tribal communities."
When the Federal government releases reports on the life expectancy levels of Asian Americans or Native Americans, The Chronicles Of Grant County will report those results.
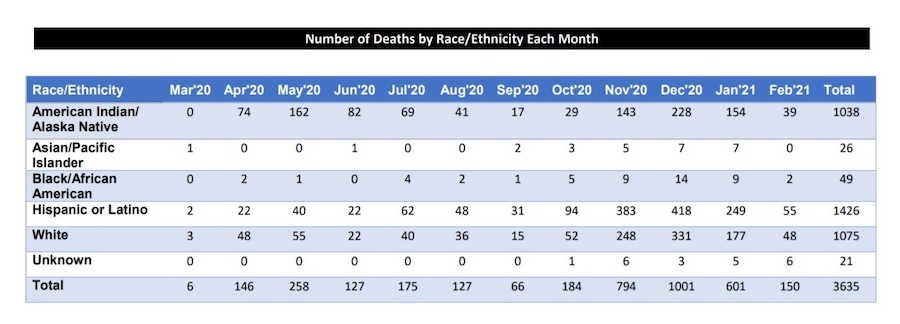 This graph details the number of deaths from COVID-19 Disease among five major racial/ethnic groups within the State of New Mexico. Of all those that have died from COVID-19 Disease in the State, 39.2% were Hispanic Americans, 29.6% were Non-Hispanic White Americans, and 28.6% were Native Americans. The statistics of the human beings who have died because of COVID-19 Disease are as of February 22, 2021, and were provided courtesy of the New Mexico Department of Health.
{pdf}mypdfs/pdf-new-mexico-department-of-health-image-of-relative-levels-of-deaths-covid-19-pandemic-two.pdf{/pdf}
PDF - New Mexico Department of Health - Image of Relative Levels of Deaths - COVID-19 Pandemic - Two
Do you have questions about communities in Grant County?
A street name? A building?
Your questions may be used in a future news column.
Contact Richard McDonough at chroniclesofgrantcounty@mail.com.
If your email does not go through, please contact editor@grantcountybeat.com.
© 2021 Richard McDonough