The Chronicles Of Grant County
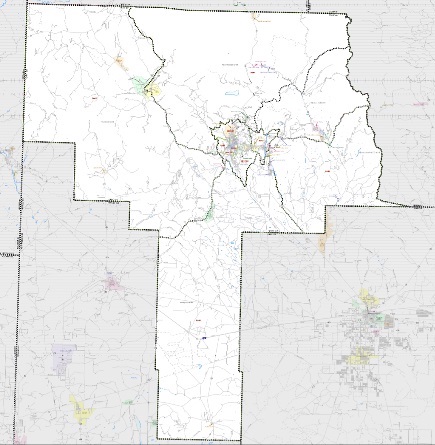 This map of Grant County is from the 2020 Census. (The image was provided courtesy of the U S Census Bureau, 2021.)
Grant County continued to lose population, according to the information released recently by the U S Census Bureau for 2020. All statistics listed in this news column for 2020 are from the U S Census Bureau as of April 1, 2020; stats for 2010 are from the same source as of April 1, 2010.
In 2020, there were 28,185 people living in Grant County. The number of residents in 2010 were 29,514. This represented a 4.5% decrease in population in the County during the preceding ten years. In 2000, there were 31,002 people living in Grant County. During the past twenty years, Grant County has seen its population decrease by 9.1%.
To put these statistics into perspective, the overall population of the United States of America increased 7.4% from 2010 to 2020 and the population of the State of New Mexico increased 2.8% during the same ten-year period.
The racial composition of Grant County has changed since 2010.
Among the major racial classifications used by the U S Census Bureau, the numbers of White people in Grant County decreased by 27.1% since 2010 to 18,266 persons in 2020. White people represented 64.8% of the population of the County in 2020; in 2010, 84.9% of the residents here were White persons.
The number of Native Americans ("American Indian" is the term used by the U S Census Bureau) increased from 400 people in 2010 to 588 persons in 2020; this group represented 2.1% of the total population in the County. The increase in this group during this ten-year period was 47%.
Two other racial groups saw increases as well. The number of Black people increased from 255 people in 2010 to 309 persons in 2020; this group represented 1.1% of the total population in the County in 2020. The increase in this ten-year time period was 21.2%. The number of Asian Americans (the Federal government uses the wording "Asian" as a race) increased from 123 people in 2010 to 202 persons in 2020; this group represented 0.7% of the total population in the County.
One other group saw a decrease in population, although the decrease was as small as possible. In 2010, there were 22 Pacific Islanders living in Grant County; in 2020, 21 Pacific Islanders were residents here. This group represented 0.1% of the overall population of Grant County.
The race of individual residents was largely done on a self-reporting basis. As the nation's culture has changed, self-identification by many Americans has changed. A number of people now identify with multiple races rather than just one race.
In Grant County, almost six times as many people indicated that they self-identified as individuals of two or more races in 2020 as compared to those who did so in 2010. The number of these individuals rose from 819 people in 2010 to 5,493 people in 2020. In addition, the number of people who indicated that they were of an "Other Race" increased by 16.5% between 2010 and 2020: 2,837 people in 2010; 3,306 persons in 2020.
The U S Census Bureau does not use "Hispanic" as a racial classification. Instead, the Federal government uses the wording "Hispanic or Latino" as an ethnicity. In 2020, there were 13,466 people who self-identified as Hispanic or Latino; in 2010, there were 14,252 persons in this group. This represented a decrease of 5.5% during the preceding ten years. Individuals who were Hispanic or Latino represented 47.8% of the population of Grant County in 2020.
That percentage is similar to the percentage of New Mexicans that were Hispanic or Latino in 2020: 47.7%. This represented an increase in this group of 6.0% statewide from 2010 to 2020. Throughout the U S, individuals that were Hispanic or Latino increased 23.0% during the same ten-year period. Individuals who were in this group represented 18.7% of the overall population – 62, 080,044 persons – of the country.
Of the overall population in Grant County, 650 people lived in group quarters in 2020. Eighty-nine persons lived in correctional facilities for adults, 216 people lived in nursing homes, and 262 persons lived in college/university student housing. Eighty-three persons lived in other noninstitutional facilities.
The number of housing units in Grant County decreased from 2010 to 2020; the numbers went from 14,694 housing units to 14,584 housing units. Of these in 2020, 15.9% – 2,315 housing units – were vacant. This represented an 9.9% increase in vacancies during the ten-year period.
In the next edition of The Chronicles Of Grant County, we'll review information from the 2020 Census for the individual communities within Grant County.
Do you have questions about communities in Grant County?
A street name? A building?
Your questions may be used in a future news column.
Contact Richard McDonough at chroniclesofgrantcounty@mail.com.
If your email does not go through, please contact editor@grantcountybeat.com.
© 2021 Richard McDonough