The Chronicles Of Grant County
2020 Census
Part Three
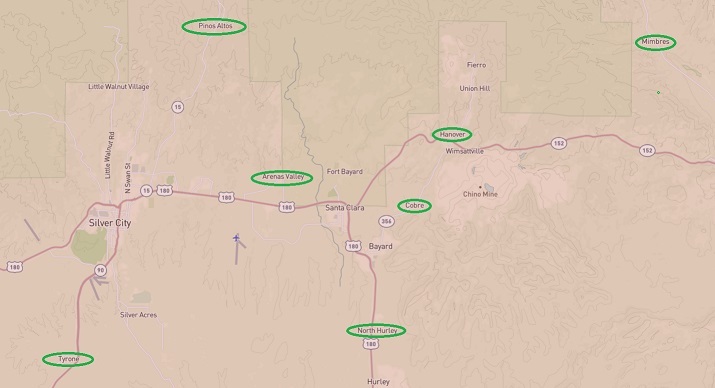 This map shows the location of a number of communities in Grant County. Seven of the eighteen census designated places are circled in green. (The image was provided courtesy of the United States Geological Survey, 2021.)
In earlier editions of The Chronicles Of Grant County, information from the 2020 Census was detailed for Grant County overall as well as for each of the four individual incorporated communities within Grant County. This edition focuses on the eighteen census designated places (CDP) in the County. These places include unincorporated lands that have been grouped together by the U S Census Bureau.
All statistics listed in this news column for 2020 are from the U S Census Bureau as of April 1, 2020; stats for 2010 are from the same source as of April 1, 2010.
The population in eleven of these CDPs decreased from 2010 to 2020, while the number of residents increased in five of these CDPs during that ten-year period. Two CDPs had no change in the number of people living in those communities from 2010 to 2020.
The Arenas Valley CDP saw its population decrease from 1,522 persons in 2010 to 1,291 residents in 2020; this was a decrease of 15.2% during the ten-year period. The population of the Buckhorn CDP went from 200 persons in 2010 to 172 people in 2020; this was a decrease of 14.0% from 2010 to 2020.
There was a 3.1% decrease in the population of the Cliff CDP from 2010 to 2020; 293 residents lived here in 2010, 284 people lived here in 2020. Seventeen people lived in the Cobre CDP in 2020, while 39 residents were in that community in 2010; this represented a 56.4% decrease in population in this ten-year period.
The population of the Gila CDP decreased from 314 people in 2010 to 285 persons in 2020 – a 9.2% decrease in number of residents during the ten-year period. The Hanover CDP saw its population decrease from 167 residents in 2010 to 144 persons in 2020; this represented a 13.8% decrease from 2010 to 2020.
The Lake Roberts Heights CDP saw its population decrease from 32 persons in 2010 to 22 people in 2020; the percentage decrease was 31.2% during this ten-year period. The population of the Mimbres CDP decreased from 667 people in 2010 to 390 people in 2020; the decrease was 41.5% from 2010 to 2020.
There was a 19.3% decrease in the number of residents living in the North Hurley CDP from 2010 to 2020. Three hundred people lived in this community in 2010, while 242 persons resided here in 2020. The Rosedale CDP saw its population decrease from 394 people in 2010 to 377 residents in 2020; this represented a 4.3% decrease during the ten-year period. Seven people lived in the Trout Valley CDP in 2020, while sixteen persons lived in this CDP in 2010 – a 56.2% decrease in number of residents during the ten-year period.
Fifty-two people lived in the Hachita CDP in 2020, while 49 residents were in this community in 2010; this represented a 6.1% increase during the ten-year period. The Piños Altos CDP saw its population increase from 198 persons in 2010 to 225 residents in 2020; this was an increase of 13.6% during the ten-year period.
An increase of 52.6% during the ten-year period took place in the San Lorenzo CDP as its population grew from 97 persons in 2010 to 148 people in 2020. The population of the Tyrone CDP went from 637 persons in 2010 to 712 people in 2020; this was an increase of 11.8% from 2010 to 2020. The White Signal CDP increased its population from 181 in 2010 to 191 in 2020; the additional ten residents represented a 5.5% increase during the ten-year period.
The population of Faywood CDP remained at 33 people in both 2010 and 2020. In the Lake Roberts CDP, the number of residents was 53 persons in both 2010 and 2020.
To put these statistics into perspective, the overall population of the U S increased 7.4% from 2010 to 2020, and the population of the State of New Mexico increased 2.8% during the same ten-year period.
The U S Census Bureau does not use "Hispanic" as a racial classification. Instead, the Federal government uses the wording "Hispanic or Latino" as an ethnicity. The percentage of the population that self-identified as Hispanic or Latino for their ethnicity varied in these CDPs in 2020.
In the Arenas Valley CDP, the percentage in 2020 was 48.0%; in the Buckhorn CDP, 7.6%; in the Cliff CDP, 9.5%; in the Cobre CDP, 94.1%; in the Faywood CDP, 66.7%; in the Gila CDP, 21.4%; in the Hachita CDP, 23.1%; in the Hanover CDP, 70.1%; in the Lake Roberts CDP, 22.6%; in the Lake Roberts Heights CDP, 45.5%; in the Mimbres CDP, 24.1%; in the North Hurley CDP, 83.1%; in the Piños Altos CDP, 15.6%; in the Rosedale CDP, 41.4%; in the San Lorenzo CDP, 62.2%; in the Trout Valley CDP, 14.3%; in the Tyrone CDP, 41.2%; and in the White Signal CDP, 20.4%.
Throughout New Mexico, the percentage of residents that self-identified as Hispanic or Latino was 47.7% in 2020. This represented an increase in this group of 6.0% statewide from 2010 to 2020. Throughout the U S, individuals that self-identified as Hispanic or Latino increased 23.0% during the same ten-year period. Individuals who were in this group represented 18.7% of the overall population – 62,080,044 persons – of the country.
Do you have questions about communities in Grant County?
A street name? A building?
Your questions may be used in a future news column.
Contact Richard McDonough at chroniclesofgrantcounty@mail.com.
If your email does not go through, please contact editor@grantcountybeat.com.
© 2021 Richard McDonough